Social Marketing is becoming more and more complex.
Every year new challengers try to grab some of Facebook’s market share. In some cases, it can be a great opportunity for businesses that want to get an edge over the competition.
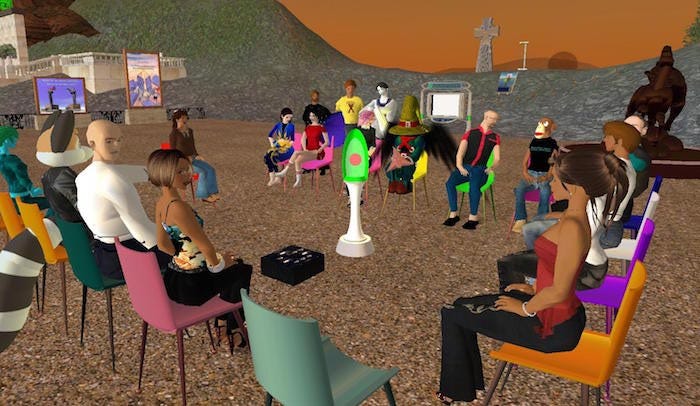
Or a massive waste of time. Remember Second Life? Yeah, me neither.

If you look closely, you’ll see a monkey and a squirrel. It was hard to find an image without naked avatars.
At GetSocial, we’re tracking 30+ social networks and messaging apps, and we thought that providing an update on how people share and access content would be good to understand a couple of trends.
Here’s our infographic (with commentary):

Top Channels Stable
The trifecta of social channels is untouched since last year: Pure Dark Social generates the most shares, Facebook provides the most traffic and everything else pales in comparison.
Referrals per Share Dropping
As more and more content gets added to social networks, each share is seen by fewer people and drives less traffic. Here we can see two kinds of social channels: the “broadcast” type, which includes Facebook, Twitter, etc., and the “personal” type, such as WhatsApp, Email, and SMS. A lot of social networks, including LinkedIn and Pinterest, generate more shares than traffic, which suggests that it is harder to convince someone to click a link on those channels.
Social Buttons phasing out
Only a small percentage of shares is done through social buttons. All the rest is done by using the share function of your mobile browser or by copy-pasting the URL on desktop.
Mobile is King and Queen
Mobile drives most shares and traffic, which correlates perfectly with the steady increase of internet access on mobile devices.
“Sharing users” Matter
Visitors who share not only generate more free traffic for websites, they also are much more engaged and loyal than the average.
Source: B2C

No comments:
Post a Comment